

“Genius is nothing but a greater aptitude for patience.”— George-Louis de Buffon, well-known 18th century naturalist
Investors have been bombarded with a set of head-spinning headlines this month and this year, but the market has absolutely taken it in stride. We think it has done so for good reason. The foundation of the economy and personal spending, as well as consumer and corporate balance sheets, remains solid. We’ve had to cope with news in this still-relatively young new year that focused on intimidating themes ranging from an old-fashioned “run” on bank deposits at selective banks and special measures to backstop FDIC insurance to “unprecedented” Federal Reserve monetary policy, which may have contributed to the fire drills in our banking industry. Also looming is the specter of upcoming congressional debates on the U.S. debt ceiling threshold violations and related consequences such as a possible government shutdown or U.S. debt downgrades or, even worse, potential default on U.S. Treasury interest payments.
Recession and Earnings Slowdown Concerns
If this isn’t scary enough for you, how about additional, less-extreme concerns being discussed by pundits and the media, including the impact of a mild recession that may finally occur later this year and earnings that could slow considerably should our economy finally hit a soft patch. And what about that fear of inflation remaining higher for longer than the Fed and the markets desire? We believe these are real issues that must be dealt with. However, that’s the point. Just like the challenges posed by the 2020 pandemic, they are being dealt with. Don’t forget, either, that the market already fell 25% from peak to trough last year in anticipation of these issues or some other shock event happening.1
Still a “Hold Your Ground” Climate
It’s far too early to give the all-clear signal on these various transitional issues and events, but we continue to believe they will be resolved in less-than-perfect, yet adequate, fashion. The government’s steps to shore up the risks at a handful of esoteric banks (with concentrated deposit bases lending to an equally concentrated and start-up-focused set of borrowers) and prevent this from becoming a broader issue is an example of an effective and better-than-feared resolution. Further, this scare is proving to be a wake-up call for the Fed that it had better slow down a bit and recognize the steps it has taken so far to get back to normal interest rate levels is enough. The Fed doesn’t need to reverse course, but it better relax a bit and recognize most of its work is done. Hence, our S&P 500 price target of 4,500 at year-end and our continued message to “hold your ground” at normal, long-term stock allocation levels.
Markets Are Moving in a Better Direction
It seems like the market agrees with us that things are moving in a better direction on most of these fronts this year. Join me now in examining the amazing set of facts regarding behavior in the financial markets that has occurred in the midst of horrible headlines and significantly negative front-page news this year:
- The S&P 500’s price advanced 3.5% in the month of March alone and 7% on a year-to-date basis through March 31—a very nice start to the year.2
- The S&P 500 is up roughly 15% from the October 2020 low through the end of March 2023 and has generated two consecutive quarters of gains for the first time since the 3Q and 4Q of 2021.3
- The more aggressive sectors of the S&P 500 have led in a huge way. Each of the growthier areas of the index—information technology, consumer discretionary and communication services—gained 15% to 22% in the first quarter, while the defensive sectors, such as utilities, staples, and health care that traditionally lead in bear markets, posted horrid relative performance results, with each down 6% to 12% relative to the S&P 500. This suggests more risk-on attitude in the market than meets the eye this year.4
- On a longer-term basis, despite a global pandemic, massive supply chain issues, an inflation scare, war in a major region of the world, intimidating Fed rhetoric and a seemingly short-lived banking crisis, the market has advanced 7% annually on a compounded basis over roughly the last three years going back to before the pandemic decline—just about in line with longer-term averages.5 Who would’ve thought? It’s been terrible out there, right?
- First quarter gross domestic product (GDP) tracked 2.5% real growth, and the continued robust payroll growth resulted in an extremely low unemployment rate of 3.6%.6 These are not recession-like metrics.
- Activity in both the manufacturing and services sectors of the economy improved throughout the quarter.
- Inflation and inflation expectations continued to improve significantly throughout the quarter with the Core Producer Price Index declining to close to the 4.5% level, and the Core Consumer Price Index moderating considerably to 5.5% from its over 6.5% peak. Three-year forward inflation expectations are at 2.2%, down considerably from 2.8% in the middle of last year. This is still above the unrealistic sub-2% inflation levels of the early 2000s.7
The point is that the market doesn’t seem nearly as crabby as the media suggests when it ignores these improvements versus 2022. Basically, the market absorbed a very rough patch in the first five months of 2022, during which it gave back some of the excess returns of 2021. The S&P 500 is roughly flat since May 2022 to the present, and we’ve been in a relatively tight trading range over that period.8 “Hold your ground” seems to have been an appropriate message, and we think it continues to be in this environment in which others need to become as convinced as we are that these transitional issues are moving in the right direction; i.e., that inflation can calm without the Fed or U.S. policymakers breaking the economy. They may dent it a bit (as the market anticipated in advance in 2022) but not cause an ugly, lasting swoon.
The Issues at Hand: Banking and Earnings
At this juncture, we thought it might be worthwhile to provide a quick update on two front-and-center issues:
1. The impact of the struggles underway in the banking industry
2. How we think the market can deal with possible further downward revisions in 2023 earnings
1. Banking Crisis? At this Point, Not
The U.S. government response to the Silicon Valley Bank (SVB) collapse was swift, and it has been effective so far. On Sunday, March 12, the FDIC announced it would cover all depositors at SVB even if above the $250,000 normal cap for insurance per depositor. It also announced that the Fed had created a facility to cover shortfalls on any bank’s “available for sale” securities if needed to prevent future realized losses on these portfolios at other banks. This seemed to appease the markets/investors.
The market response gives us confidence. The S&P 500 is up 5% from March 9—the day before SVB went into receivership.9 The banking sector is, of course, showing stock price weakness, but the balance of the market is exhibiting resilience/stability.
Bonds Are Faring Well
Bonds have reacted with equal or even more positive vigor. Yields have fallen significantly. The 10-year Treasury has declined from over 4.2% prior to SVB to 3.5% as of March 31.10 This is significant. These rate declines lessen losses at SVB (and at other vulnerable banks) and can serve as a pillar of support to the equity markets as a pause in Fed rhetoric has been a signal the market has been looking for to advance and recover from the weakness in 2022.
Fed Funds Futures Curve Has Fallen
The fed fund futures curve has also fallen significantly, as it is no longer calling for ongoing, additional rate hikes. As of March 31, it suggests the Fed may only hike by an additional 25 basis points and may be looking to cut rates thereafter.11 Certainly, recent Fed discourse acknowledges that the fragility illustrated at SVB and associated repercussions will tighten lending standards and serve to lower loan growth. In essence, these impacts have done some of the work for the Fed rather than it having to take additional action to calm inflation/slow the economy and have the equivalent effect of a rate hike or two by the Fed. These may be unintended consequences of the SVB debacle, and more serendipitous in nature, but they are productive.
Unemployment Report
The unemployment report released on Friday, March 10, was outstanding. It signaled moderation in employment growth coupled with a slowing in wage growth and an increase in the labor participation rate… exactly what the Fed needed to see as cover to slow the pace of the hikes or simply pause, regardless of the banking news these past few weeks.12 Another one or two in-line or “less-worse” CPI reports in upcoming weeks, coupled with friendlier payroll reports like March’s, could give Fed policy makers additional reason to soften their tone and action at this time and would be well received by the market.
2. Won’t Negative Earnings News/Revisions Sabotage Stock Returns?
This is one of the major bear arguments, and quite frankly, as students of history, we just don’t get this thesis. We understand that this might make intuitive sense, but history shows us that generally, stock returns are not correlated to near-term trends in earnings growth. Why? Because the market is always anticipatory and more concerned about where it thinks earnings are headed in the future rather than how the near-term current calendar year will close out. The chart below illustrates the 11 periods in recent history during which S&P 500 earnings per share (EPS) declined by more than 10% in a calendar year.
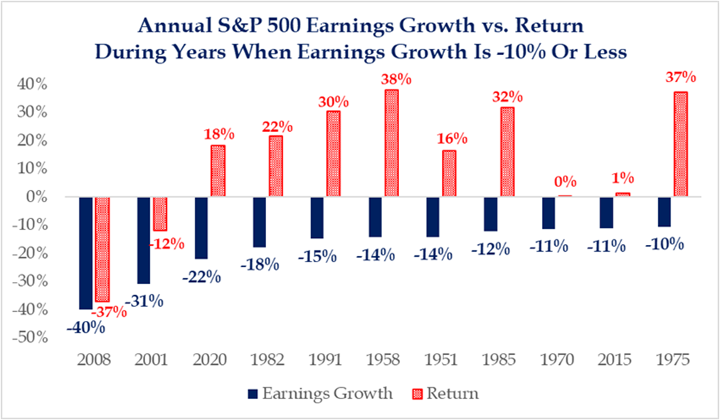
Source: Strategas
Calendar Year Earnings vs. S&P Returns
In nine of those 11 periods of horrible calendar year earnings, the market was up handsomely. In the only two periods in which negative earnings were accompanied by poor stock returns (2001 and 2007-2008), we were in the midst of recessions of historic proportions, unlike the mild recession we expect currently. In the other nine periods of positive returns, the market already knew the current calendar year earnings outlook was bad and had reacted to it in advance; it was looking forward to the earnings trend and expectations for the recovery in the next or following year. Hence, the frequent phenomenon of weak current calendar year earnings, yet strong current calendar year S&P 500 returns.
Therefore, it’s 2024 earnings that are more important to us than 2023 figures and trends. If near-term earnings trends and returns were joined at the hip, how could we see solid earnings growth last year, yet negative stock returns in 2022? How could we see earnings decline by 32% in 2020, yet the market advance 18% that year?
Currently, consensus S&P 500 Earnings Per Share (EPS) for 2023 is roughly $220 and $247 for 2024. See the graph below on trends in these figures.
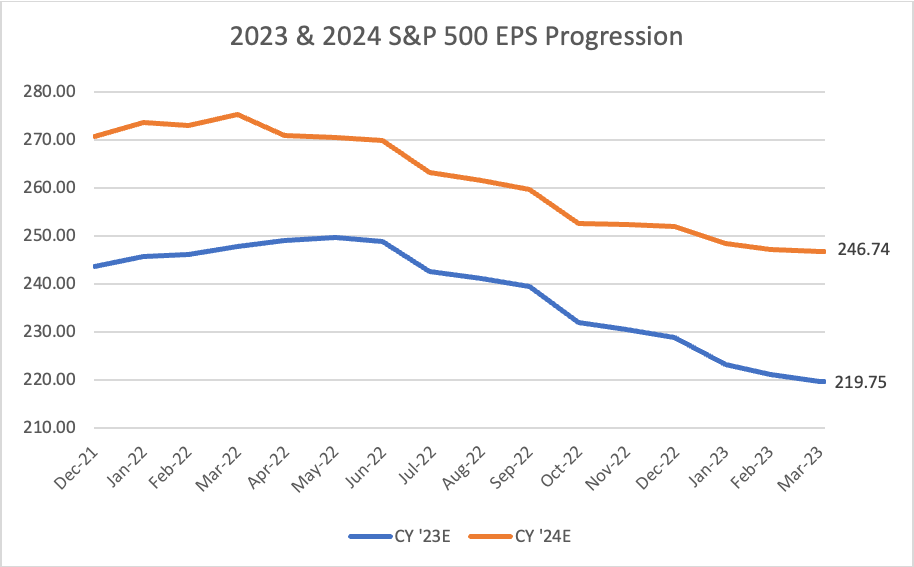
Source: Data sourced from FactSet as of April 3, 2023.
2023 may slip a bit as past Fed rate hikes start to have some bite and slow the economy somewhat in the Fed’s mission to calm inflation. We actually think that’s a good thing, as this should set the stage for economic and earnings recovery in 2024. Any slowdown looks to be modest in nature in 2023 as employment and balance sheets are far stronger than at similar stages of past recessions.
P/E, EPS and Interest Rates
Market price levels result from the interplay of price/earnings (P/E) levels, EPS, and interest rates/inflation. All three have impact, but we would argue that trends in P/E’s and interest rates swamp fluctuations in EPS growth. If you look at the market decade by decade from 1950 through the present, the best decades were ones of uninspiring earnings growth coupled with improving trends in inflation and interest rates from peak-level scares that led to P/E multiple expansion or maintenance of healthy multiples. This combination was far better than outrageously strong EPS growth, yet rising inflation and interest rates. That explains the 1950s and the 1990s, for example. Both of these were periods of around 5% EPS growth, yet interest rates stabilized/fell from peak levels and earnings multiples climbed to the high double-digits.13 The ’90s got ridiculous with respect to P/E levels, and we don’t expect that to repeat, but we do envision 18-19 times if inflation continues to slow down from the 2022 spike, the Fed backs off and the economy doesn’t fall apart.
Our S&P 500 Target Range
S&P 500 targets are based on forward, not trailing, earnings… that’s how it works. In that vein, the market cares more about 2024 at this point versus 2023—as do we. Our target of 4,500 is based on a multiple of 2024 earnings because in December 2023, that is how the market will price it. So, the math is:
December 2023 S&P 500 Price Target = Forward P/E Multiple of 18 X 2024 EPS of $247 = 4,446.
We can conduct some sensitivity analysis to this. Let’s say EPS expectations for 2024 decline to $240, then 18 X $240 = 4,320. If inflation continues to come in high, multiples could expand to 19 times, and 19 X $240 = 4,560. If consensus earnings hold ground and are not revised down, 19 X $247 = 4,693. Therefore, we believe a reasonable target range for the S&P 500 at calendar year end 2023 or early 2024 is 4,320 to 4,800. That’s the logic.
Profit margins should improve in 2024 if inflation continues to look less worse and productivity bounces off worst-case levels (which it should do, as John and Jane Doe workers are on the job for more than a month; the quit rate has been so high that 50% of us are new to our jobs and don’t even know where the water cooler is yet, let alone know anything about our employers’ products and operations). Rising productivity should be a boost to and support growth and recovery in earnings in 2024.
Wrap-Up
Patience is the key, though tough to execute, during these periods of transition risk. Practice patience, be balanced between growth and value as leadership rotates, use bonds effectively for diversification and employ some level of active management to add value. Those continue to be our messages—not unlike keep your left arm straight, your head down and follow through in golf. This is the time to be a student of history, maintain discipline and be boring.
Sources
1-5FactSet
6Atlantafed.org and FactSet
7-10FactSet
12U.S. Bureau of Labor Statistics
13Historical data from SBBI and FactSet
Disclosures
The S&P 500 Index is a market-value weighted index provided by Standard & Poor’s and is comprised of 500 companies chosen for market size and industry group representation. The index is unmanaged and cannot be directly invested into. Investing involves risk and the potential to lose principal. Past performance does not guarantee future results.
This commentary is limited to the dissemination of general information pertaining to general economic market conditions. The views expressed are for commentary purposes only and do not take into account any individual personal, financial, or tax considerations. As such, the information contained herein is not intended to be personal legal, investment, or tax advice or a solicitation to buy or sell any security or engage in a particular investment strategy. Nothing herein should be relied upon as such, and there is no guarantee that any claims made will come to pass. Any opinions and forecasts contained herein are based on the information and sources of information deemed to be reliable, but Mariner Advisor Network’s does not warrant the accuracy of the information that any opinion or forecast is based upon. You should note that the materials are provided “as is” without any express or implied warranties. Opinions expressed are subject to change without notice and are not intended as investment advice or to predict future performance. Consult your financial professional before making any investment decision.
Mariner Advisor Network is a brand utilized by Strategic Wealth Advisors Group (“SWAG”) and Mariner Platform Solutions (“MPS”). Investment advisory services are offered through Investment Adviser Representatives registered with SWAG or MPS, each an SEC registered investment adviser. Registration as an investment adviser does not imply a certain level of skill or training. SWAG and MPS comply with the current notice filing requirements imposed upon registered investment advisers by those states where they transact business and maintain clients. SWAG and MPS have either filed notice or qualify for an exemption or exclusion from notice filing requirements in those states. Any subsequent, direct communication by SWAG or MPS with a prospective client shall be conducted by a representative that is either registered or qualifies for an exemption or exclusion from registration in the state where the prospective client resides. For additional information about SWAG or MPS, including fees and services, please contact SWAG/MPS or refer to the Investment Adviser Public Disclosure website (www.adviserinfo.sec.gov). Please read the disclosure statement carefully before you invest or send money.
For information about which firm your advisor is registered with, please refer to the Investment Adviser Public Disclosure website (www.adviserinfo.sec.gov) or the Form ADV 2B provided by your advisor.
Investment Adviser Representatives are independent contractors of MPS or SWAG and generally maintain or affiliate with a separate business entity through which they market their services. The separate business entity is not owned, controlled by, or affiliated with MPS or SWAG and is not registered with the SEC. Please refer to the disclosure statement of MPS or SWAG for additional information.