

As we near year-end, we are cautious about S&P 500 returns in the near term. Our S&P 500 targets for year-end 2023 and mid- to late-year 2024 remain the same at 4,500 and 4,800 to 5,000, respectively. Clearly, these are relatively constructive figures. Our message to investors continues to be “hold your ground,” meaning hover at your normal or neutral allocation for stocks.
We hope clients heard our message back in July that if the 20% rally off the October 2022 low had pushed your stock allocation above normal levels, cut back to your long-term strategic target. Then and now, we urge you not to buy on the dips and aggressively increase your stock allocation. At the same time, we encourage investors not to sell down and reduce their stock exposure to below normal levels.
Despite our positive outlook over the intermediate and longer term and our higher targets for the S&P 500 price levels over these time frames, we are cautious on index returns in the near term or the next several months.
A number of wall of worry items ranging from geopolitical conflict in multiple areas, such as the Middle East, to rising interest rates and seasonality could inspire headline risks and associated temporary price-to-earnings (P/E) multiple contraction.
Currently Holding a Neutral Stance
Whereas we were bullish going into 2023, we are neutral in tenor at present. At the beginning of the year, individuals seemed to be uber-negative and convinced that a near-term recession and associated earnings implosion was inevitable as was runaway inflation and misguided Federal Reserve policy per general press coverage at that time. Based on our review of the data, we didn’t see such a dire environment and believed the risks were to the upside. At this juncture, following the hard run exhibited by U.S. stocks from October 2022 through the end of July, we think the near-term price risks are to the downside for several months.
Summary of Year-end Forecast and Concerns:
- We believe there continues to be opportunity through active management in the equity markets as we head into year-end.
- We think the major wall of worry items, such as fears of elevated inflation, concerns about an over-zealous Fed, angst over the fiscal debt and government shutdown, as well as obvious geopolitical tensions and global conflict, are all manageable risks and should result in better-than-feared outcomes. We do believe that the third quarter earnings season will be solid, and inflation will continue to calm. This forms the foundation of our more constructive intermediate- and longer-term view.
- Eventually, as other investors see that these latter, key fundamental factors are trending in a solid direction, we believe the stock market should continue its advance to new highs.
- The one wall of worry item that truly concerns us is the continued advance in yields. While our base case assumes that 10-year Treasury rates will stabilize at close to current levels as inflation continues to subside, we would become meaningfully more defensive if this does not occur and rates rise significantly from here.
What’s Going On With the Recent Surge in Treasury Yields?
We’ve received many questions about the significant rise in the 10-year Treasury yield and long-term interest rates. These include inquiries such as, “How concerned are you about this trend in interest rates rising to levels we haven’t seen in several decades? Will it continue, and could it derail your positive outlook on the market for 2024? Is rising fiscal debt the cause of rising yields and, if so, will this drive rates to unhealthy levels?”
We take this issue very seriously. The recent relatively significant rise in the yield on the 10-year U.S. Treasury is the major risk that concerns us. We’re worried that if rates rise further from here and tighten credit conditions so much that it could cause a mild recession or, even worse, a credit crunch and hard-landing recession. The chart below shows that rising rates are not a real risk to stock returns until they breach the 5% to 6% level.
This data from J.P. Morgan illustrates that there is a healthy and positive correlation between trends in P/E levels and interest rates for a while. Both rise together up to that point. This positive correlation ceases once interest rates hit that level and rise substantially further. Stock market P/Es tend to decline if rates rise further, thus causing stock market returns to be much more dependent on earnings growth alone at that point and lower than they would have been otherwise.
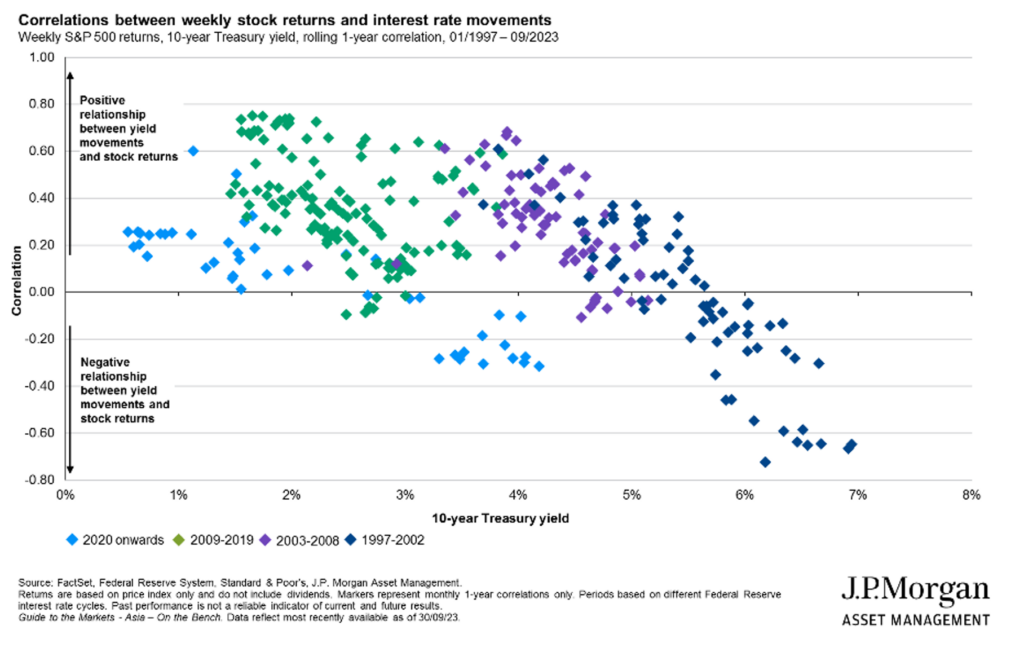
Source: J.P. Morgan Guide to the Markets-Asia (9/30/2023)
Our base case does not embrace a view that rates surge from here, but this is a key risk we are monitoring. If such a trend would develop, the near-term correction would be more severe and would probably inspire us to make active decisions to become more defensive in the stock exposure held in client portfolios for a period of time. The offsetting news is that the cure for high rates is exactly that—higher rates! If the 10-year were to rise well above 5% and approach the 6% level or more, economic growth would be at risk. The Fed would then likely be compelled to cut rates far quicker than it (or the financial markets) anticipates at present. Should this more challenging scenario develop, after adopting a more defensive posture for a bit, we would be inspired to become aggressive buyers of stocks within a reasonable time as the Fed switched course and employed a more accommodative policy. However, this would not be a pleasurable path to eventual new highs in stocks.
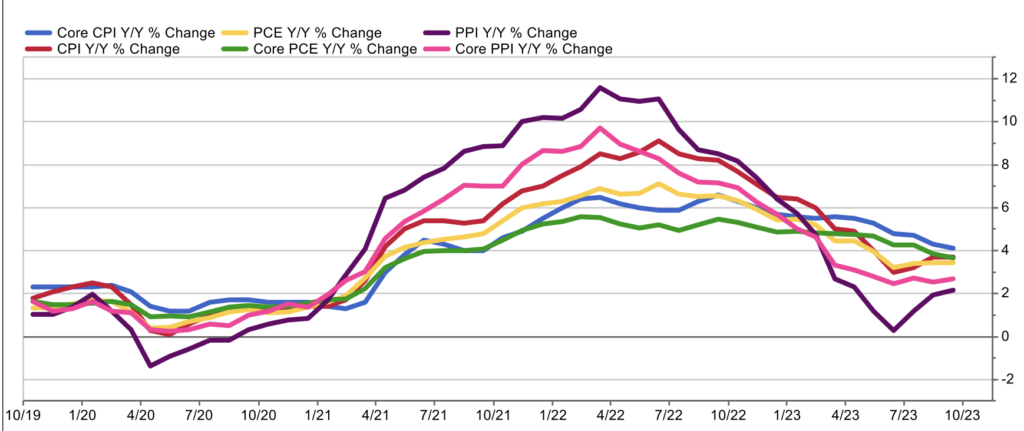
As for the whys that support our view that rates should stabilize at these levels or close to them, we offer the following thoughts. First and most importantly, inflation is calming, and that has been the major catalyst for driving rates higher, raising inflationary fears. We think these fears should subside in short order. The graph below shows that the alphabet soup of inflation peaked quite some time ago, and these various measures of it have fallen significantly.
| Peak Y/Y Change | Current Y/Y Change | Peak to Current Change | Month Peaked | |
|---|---|---|---|---|
| CPI | 9.1% | 3.7% | -5.4% | June 2022 |
| Core CPI | 6.6% | 4.1% | -2.5% | September 2022 |
| PCE | 7.1% | 3.4% | -3.7% | June 2022 |
| Core PCE | 5.6% | 3.7% | -1.9% | February 2022 |
| PPI | 11.6% | 2.2% | -9.4% | March 2022 |
| Core PPI | 9.7% | 2.7% | -7.0% | March 2022 |
The recent rise in the 10-year Treasury yield should only reinforce the restrictive policy the Fed has put in place and aid the battle it appears to be winning in calming the temporary pandemic-related spike in inflation.
What About This Surge in U.S. Fiscal Debt and Its Influence on Rising Rates?
Clearly, other reasons for rates potentially going higher include rising U.S. fiscal debts reflected in more government borrowing and higher issuance of Treasury bonds. The chart below illustrates the surge in government borrowing and spending employed to support the economy during the pandemic-related shutdown, which allowed us to navigate through that global challenge.
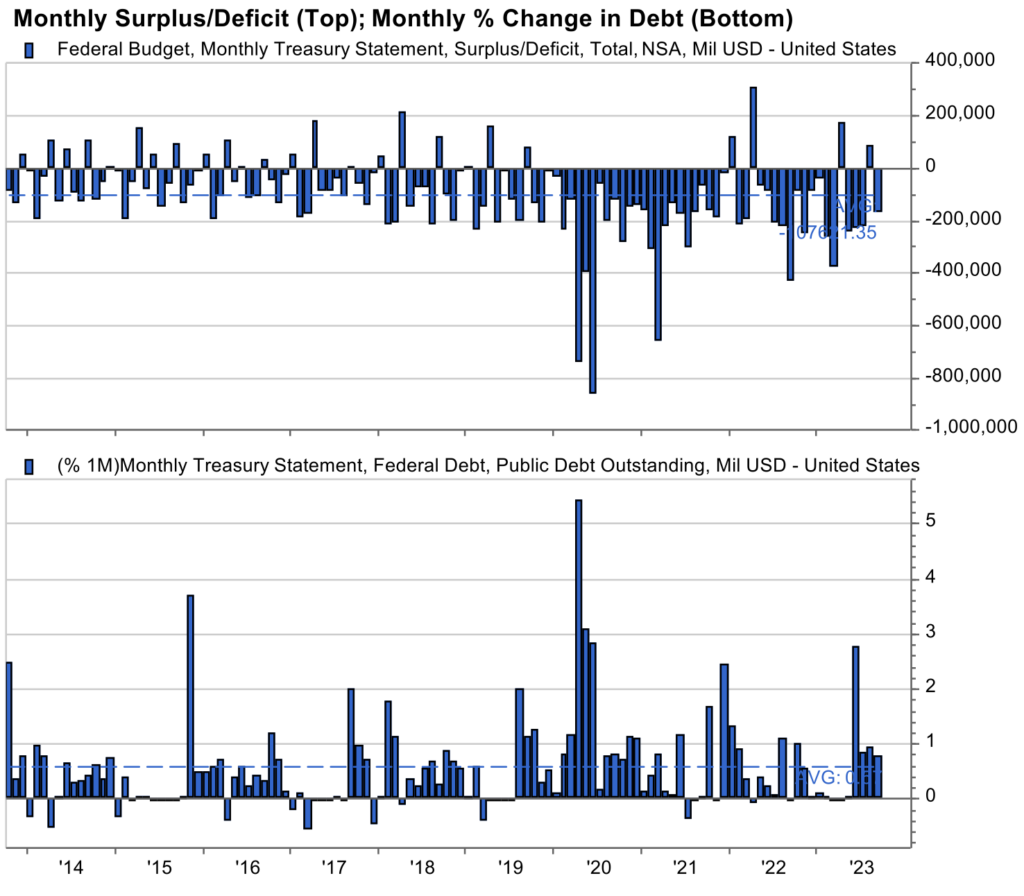
Source: FactSet
The associated fear is that such elevated levels of borrowing causes supply/demand in the Treasury bond market to get out of whack and results in demand for Treasuries that is insufficient to absorb the elevated levels of issuance or new supply in bonds. We think the headlines exaggerate this risk. While supply has been a bit excessive lately, we still see plenty of domestic demand for U.S. Treasuries. Demand should increase when rates normalize to the higher levels that we have seen lately versus the abnormally low 0% to 1.5% 10-year Treasury yield we saw several years ago. Buyers should come in and start extending duration now that conditions have gone back to normal. This should serve to attract bond investors who are likely to adopt the following logic, “The Fed is about done, real yields are back to normal levels and inflation is calming to lower levels… buy bonds!”
To put things in context, we must remember that the average intermediate Treasury yield going back to 1799 is 4.75%,1 which is just about where we are now. After experiencing flat to negative real, after-inflation yields for roughly 15 years following the housing implosion of 2007/2008, all that has happened so far is that real rates have gone back to historical averages of positive 1% to 2%.2 You can see this in the math. The current approximate 5% 10-year Treasury yield3 minus the current 3% annualized run rate in inflation equals a 1% to 2% real yield, which is right back at the long-term historical average. This restoration of normal should foster healthy demand for bonds.
A final point on the domestic demand front is that interest rates have risen in the midst of a policy of quantitative tightening (QT) undertaken by the Fed over the last 18 months. Specifically, the Fed has reduced its purchases of U.S. bonds by roughly $50 billion per month, or at an annual run rate of $600 billion annually. This is roughly equivalent to the additional supply of Treasuries expected to come to market above prior expectations over the next year because of additional government spending and lower-than-expected tax revenues. The Fed could cease such QT anytime it wants, if needed, to address further increases in 10-year rates. The Fed could become buyers of U.S. bonds again, if need be, and we think it would do so in any surging rate scenario.
Regarding the attitudes of foreign buyers of our bonds, contrary to popular headlines, foreign demand for our Treasuries remains stable and solid. Signs that foreign investors are nervous about our fiscal picture are lacking at present. To wit, the dollar is strengthening rather than weakening, which it would if foreigners were losing faith. The majority of global transactions continue to be settled in dollars, and the majority of global central bank reserves are held in dollars. The “flight to quality” factor remains in play, in our view—if the global economy sneezes, investors continue to flock to U.S. Treasuries. None of this would be true if investor concern about our fiscal debt were an immediate-reason to reduce exposure to U.S. equities or bonds. Those are the red-flag signals we look for here… a falling U.S. dollar, declining dollar reserves and settlements, weakening foreign demand for our bonds, etc. Someday these signals will arrive if we continue down this path, but it is premature to make that call today.
The Stock Market and War
We thought an update on stock market behavior around periods of rising geopolitical conflict and war was appropriate given the situations in Ukraine, the Middle East and in recognition of the rising tension between China and Taiwan. This is the one wall of worry item that is virtually impossible to anticipate or build investment strategies around. Regional as well as broader conflicts break out suddenly and unpredictably. What’s interesting is that market reactions to them are equally hard to predict… both at the index level and in regard to performance of various sectors within the index. Members of our investment team have studied this for years, and the results of our research disprove our (and probably clients’) instincts that the market probably does poorly prior to and during the crisis events and that it must take a lot of time for the market to heal if the war is significant and broad in scope. Further, one might be tempted to assume that defensive sectors of the market outperform the more growth-oriented sectors. Our research demonstrates none of this is accurate. We discovered that, historically, the market’s behavior is quite random at these times.
Market Performance (%)
| Event | Event Start Date | 3 Mos. Prior | 3 Mos. After | 6 Mos. After | 12 Mos. After | 24 Mos. After |
| World War II-Pearl Harbor | 12/7/1941 | -8.2 | -12.3 | -9.7 | -8.1 | 26.3 |
| Korean War | 6/25/1950 | 2.8 | 7.2 | 10.8 | 17.6 | 36.2 |
| Vietnam-U.S. bombs Cambodia | 8/2/1964 | 3.8 | 2.4 | 5.3 | 2.7 | -1.0 |
| Cuban Missile Crisis | 10/27/1962 | -4.7 | 20.9 | 27.8 | 35.7 | 56.1 |
| Gulf War Ultimatum | 1/17/1991 | 9.8 | 19.1 | 16.2 | 27.7 | 33.3 |
| Average | 0.7 | 7.5 | 10.1 | 15.1 | 30.2 | |
The table above that includes periods of conflict ranging from World War II years ago to the Gulf Wars captures this point. Instead of being negative, in several of these outbreaks, the market didn’t falter at all… Korea and the Gulf War in 1991 are good examples. The market did just fine in the months before, during and after these conflicts. Right before the U.S. entered World War II when Pearl Harbor was bombed, the market declined 8% in the three months prior, and it stayed negative in the 12 months after. However, 24 months after this attack, the S&P 500 was up 26%. It continued to advance at a double-digit pace from 1942 to 1947 and averaged a 9.8% return for the decade. During Korea in the 1950s, the market was solidly positive and posted one of its best 10-year returns for a decade, advancing over 15% per year in the 1950s. Fast forward to today, and the market is virtually flat since Russia invaded Ukraine in February of 2022. Stay tuned on this.
What we find is that the market climbs the headline wall of worries surrounding the shock of war but stays grounded on the trends in the economy and the impact to commerce. We will do the same in the current conflicts that challenge the world and continue to take our cues from trends in fundamentals, valuations and technicals (FVTs) rather than from the horrific headlines to determine our thoughts about the market and associated portfolio positioning. Like everyone else, we are extremely saddened by the human suffering that occurs around these events, but we must keep these emotions separate from our judgments on the impact the events have on global capital markets.
Wrap-Up—Our Outlook in More Detail
In terms of outlook, as mentioned in the introduction, we maintain our “hold your ground” message. While constructive on the intermediate to longer term (next 12 to 15 months), we are cautious on the near term or next several months during a period of transition in the market. We see the market transitioning back to normal. In other words, to higher, normal levels of interest rates and inflation. Bill Greiner, our chief economist, holds the same view. In the intermediate to longer term, we absolutely think the return to normal is better/healthier than the 0% interest rates and deflationary fears we experienced from 2008 to around now, but this path back to normal is uncomfortable for many investors. People forget that 5% nominal and 1% to 2% real or after-inflation yields are normal and that the economy historically does just fine in such an environment, as does earnings growth.
The questions for 2024 are, how high will rates go or how scared will people be that rates might go higher, even if they don’t? Clearly, we think these are the main concerns versus the government shutdown, geopolitical issues, etc. Not unlike how people became very negative about the likelihood of recession in 2022, which caused the stock market to decline 25% from peak to trough that year, even though a recession didn’t develop, investors’ fears of rising rates today could take the market down in late 2023 and 2024, even if rates stop rising.
When Bill Greiner and the equity team examine the trend in the data, we think inflation is calming and that intermediate-term rates like the 10-year Treasury should stabilize to about where they are now—that’s our base case. In assessing the odds, we think there is a two-thirds to 75% chance that happens, and that would be supportive of an S&P 500 of 4,500+ by the second half of next year and perhaps more like 4,800 to 5,000 by year-end.
Bill and the equity team have discussed bonds likely doing very well next year. We believe the Fed will likely cut short-term rates in the second half of 2024 to keep real yields where they should be in a declining inflation environment. Profit margins and earnings should be fine as productivity increases due to workers not quitting every day to take on a new job. Stable rates, solid earnings and P/Es hovering at current reasonable levels get us to that 4,500+ S&P 500 target.
That said, we believe there is a 25% to one-third chance this is absolutely incorrect, and that inflation reaccelerates or that the bond vigilantes take rates too high over concerns about our fiscal debt. In this potential scenario, new Treasury issuances could overwhelm demand and rates could keep going up. Again, this is not our base case and not highly likely, in our view, but certainly this unpleasant scenario has a better-than-0% chance of happening. As we like to say, the cure for high rates generally is just that—high rates. Ironically, if this were to play out, after adopting a more defensive position for a time, we would eventually likely become aggressive buyers of stocks following some pain and pullback.
Bottom line, we have a fairly strong conviction that we will see 4,500+ for the S&P 500 sometime next year. The problem is we don’t know the exact path or timing of achieving this level. Simply the fear of higher rates is going to cause near-term chop and temporary P/E contraction that could last several months or quarters before the rest of the world comes to our view that inflation is calming, the Fed is finished and fundamentals are better than feared. When this happens, we will approach or hit new highs. In the interim, however, this rate fear we allude to could cause a short, but meaningful, correction late this year or early next. Again, this takes us to a constructive outlook but a hold-your-ground stance for now.
Footnote
1Economist Ed Yardeni
2Data sourced from FactSet as of 9/30/23
3Data sourced from FactSet as of 10/23/23
The S&P 500 Index is a market-value weighted index provided by Standard & Poor’s and is comprised of 500 companies chosen for market size and industry group representation. The index is unmanaged and cannot be directly invested in. Past performance does not guarantee future results.
This commentary is for informational and educational purposes only and is limited to the dissemination of general information pertaining to our investment advisory services and general economic market conditions. The views expressed are for commentary purposes only and do not take into account any individual personal, financial, or tax considerations. As such, the information contained herein is not intended to be personal legal, investment, or tax advice or a solicitation to buy or sell any security or engage in a particular investment strategy. Nothing herein should be relied upon as such, and there is no guarantee that any claims made will come to pass. Any opinions and forecasts contained herein are based on the information and sources of information deemed to be reliable, but we do not warrant the accuracy of the information that any opinion or forecast is based upon. You should note that the materials are provided “as is” without any express or implied warranties. Opinions and forecasts expressed are subject to change without notice and are not intended as investment advice or to predict future performance. Actual results or developments may differ materially from those projected. Investing involves risk and the potential to lose principal. Please consult your financial professional before making any investment decision.
Fixed-income securities are subject to increased loss of principal during periods of rising interest rates and are subject to various other risks, including changes in credit quality, market valuations, liquidity, prepayments, early redemption, corporate events, tax ramifications, and other factors.
Mariner Advisor Network is a brand utilized by Mariner Independent Advisor Network (“MIAN”) and Mariner Platform Solutions (“MPS”). Investment advisory services are offered through Investment Adviser Representatives registered with MIAN or MPS, each an SEC registered investment adviser. Registration as an investment adviser does not imply a certain level of skill or training. MIAN and MPS comply with the current notice filing requirements imposed upon registered investment advisers by those states where they transact business and maintain clients. MIAN and MPS have either filed notice or qualify for an exemption or exclusion from notice filing requirements in those states. Any subsequent, direct communication by MIAN or MPS with a prospective client shall be conducted by a representative that is either registered or qualifies for an exemption or exclusion from registration in the state where the prospective client resides. For additional information about MIAN or MPS, including fees and services, please contact MIAN/MPS or refer to the Investment Adviser Public Disclosure website (www.adviserinfo.sec.gov). Please read the disclosure statement carefully before you invest or send money.
For information about which firm your advisor is registered with, please refer to the Investment Adviser Public Disclosure website (www.adviserinfo.sec.gov) or the Form ADV 2B provided by your advisor.
Investment Adviser Representatives are independent contractors of MPS or MIAN and generally maintain or affiliate with a separate business entity through which they market their services. The separate business entity is not owned, controlled by, or affiliated with MPS or MIAN and is not registered with the SEC. Please refer to the disclosure statement of MPS or MIAN for additional information.